Who Gets Left Behind in Oakland?
In Oakland, where you live and the color of your skin still shape your economic future.
Employment, Income & Poverty Inequity
In Oakland, economic opportunity is not evenly distributed. Black residents face nearly double the unemployment rate of White residents and earn just over one-third as much in median household income. These disparities drive a cycle of poverty that continues across generations.
| Demographic Group | Unemployment | Median Income | Poverty Rate |
|---|---|---|---|
| White | 4.2% | $110,000 | 8.4% |
| Black | 8.9% | $37,500 | 26.1% |
| Latino | 4.5% | $65,000 | 21.9% |
| Asian | 5.8% | $76,000 | 15.0% |
Till 2020 in Oakland, African Americans were most likely to be living at or below the federal poverty level (26.1%), compared to 21.9% of Latinos, 15.0% of Asians, and 8.4% of Whites. This means that more than one in four African Americans and more than one in five Latinos were living at or below the federal poverty level. African Americans were 3.09 times more likely than Whites to be living at or below the federal poverty level.
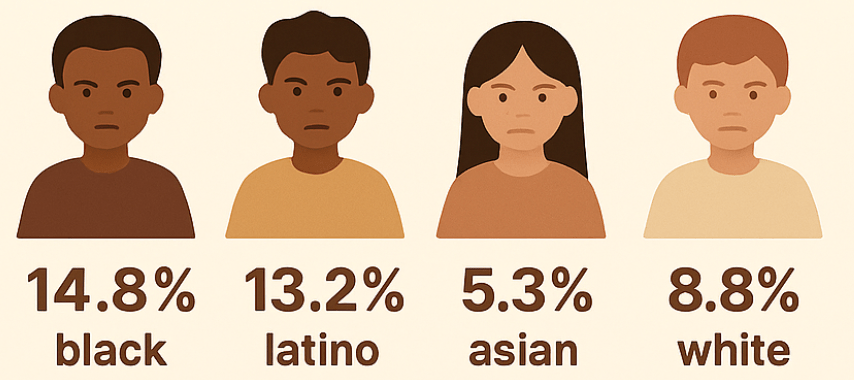
Disconnected Youth
Too many young people are being left behind. Black and Latino youth are significantly more likely to be disconnected from both school and work—cut off from the support and structure that builds a pathway to stability and success.
Citywide, one in ten youth were neither working nor in school (10.3%). African American youth were the most likely to be disconnected (14.8%), followed closely by Latino youth (13.2%). Asian youth were the least likely to be disconnected (5.3%), while 8.8% of White youth were disconnected. African American youth were 2.8X times more likely to be disconnected from both work and school than Asian youth.
Housing Burden and Displacement
Rising rents and stagnant wages are forcing low-income families to make impossible choices. In communities of color, the housing burden is compounded by aging buildings, overcrowding, and a lack of legal protections—making displacement an everyday reality.

The above housing burden indicator map measures the percent of households in a census tract that are both low income (making less than 80% its county median family income) and severely burdened by housing costs (paying greater than 50% of their income to housing costs).
Infrastructure Gaps
Not All Neighborhoods Are Built the Same
From broken sidewalks to unmaintained parks, Oakland’s infrastructure reveals deep inequalities that affect health, mobility, and dignity.
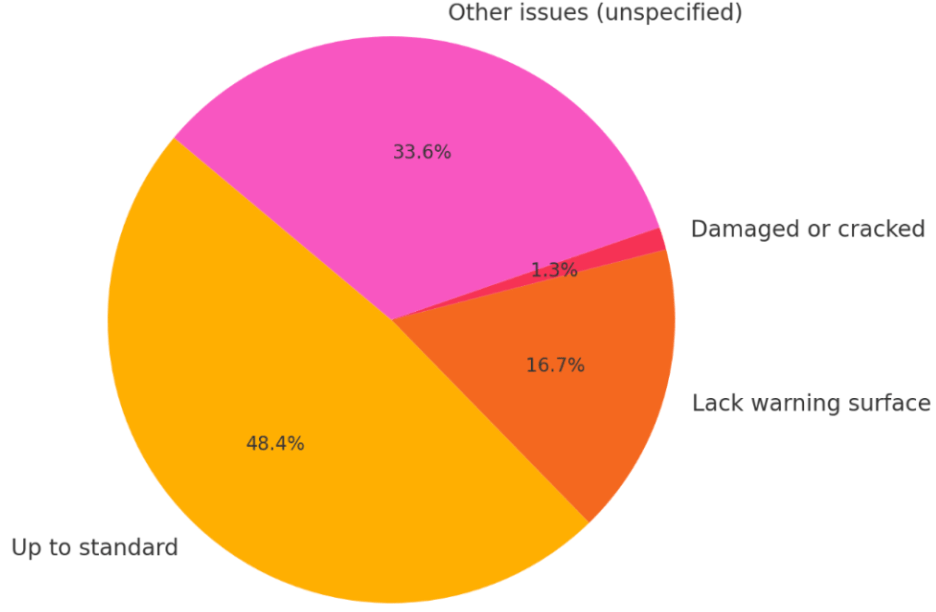
🛑 Curb & Sidewalk Conditions

🚗 Access to a Car


🏞️ Park Quality by District
The kids who need parks the most are growing up with the least.
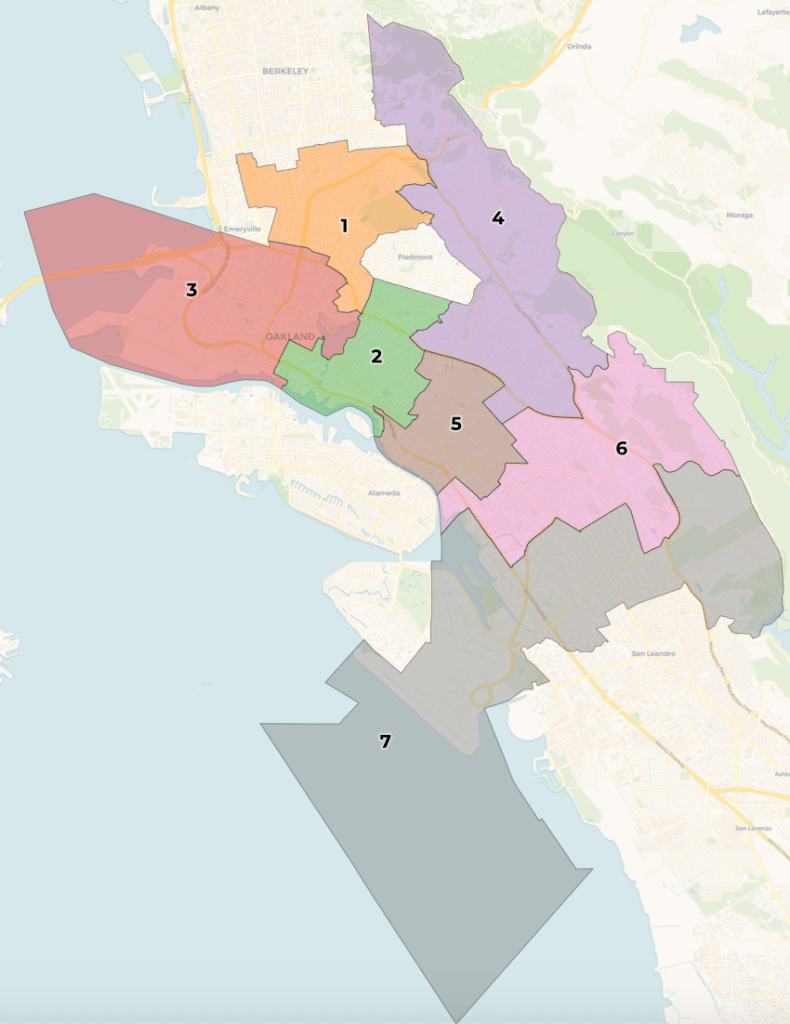
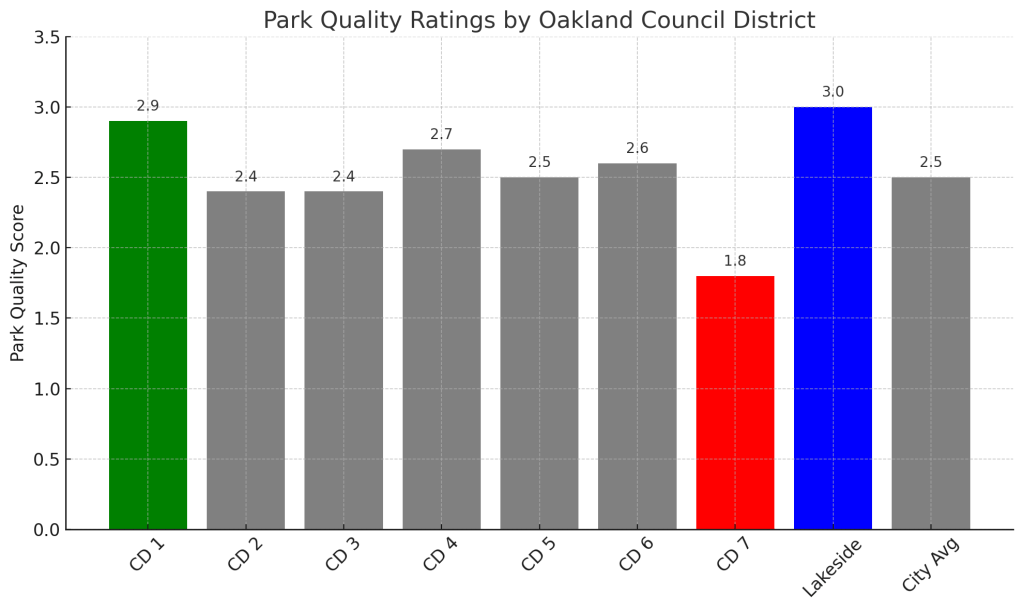
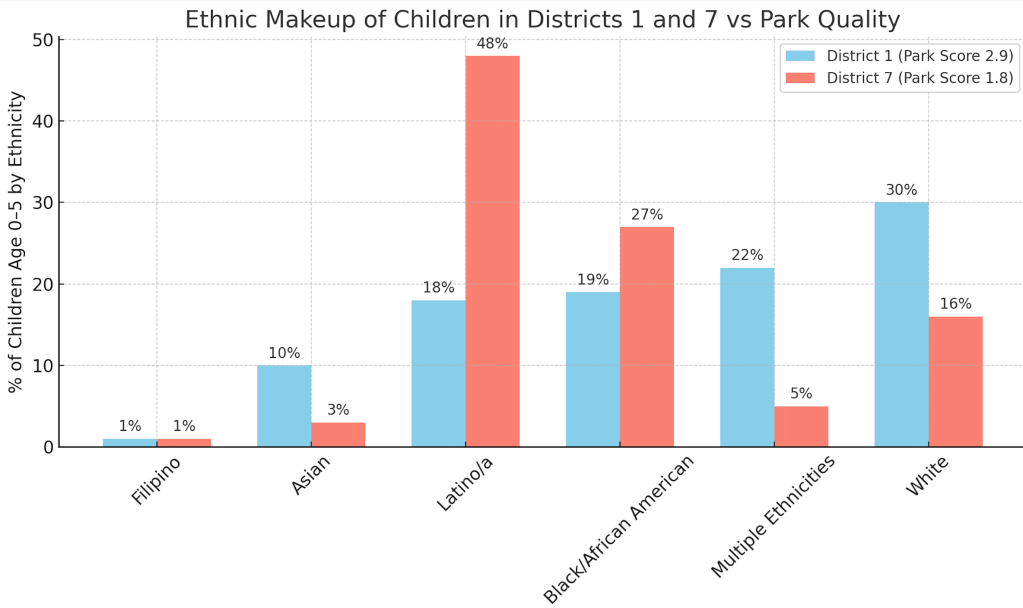
In District 7, where Black (27%) and Latino/a (48%) children make up the vast majority of kids under 5, the average park quality score is just 1.8 — the lowest in Oakland.
Meanwhile, in District 1, where White (30%) and Multi-ethnic (22%) children are more prevalent, parks score 2.9, the highest rating in the city.
This isn’t just a data point — it’s an outcome of historic disinvestment, redlining, and prioritized wealthier communities in city planning. Park quality isn’t just about playgrounds — it’s about clean air, green space, safe gathering spots, and childhood joy of the city’s future generation.
Explore the data for yourself?
Links:
